
Monitoring and alerting
Device availability, health readings and collection coverage, with alerts grouped by location.
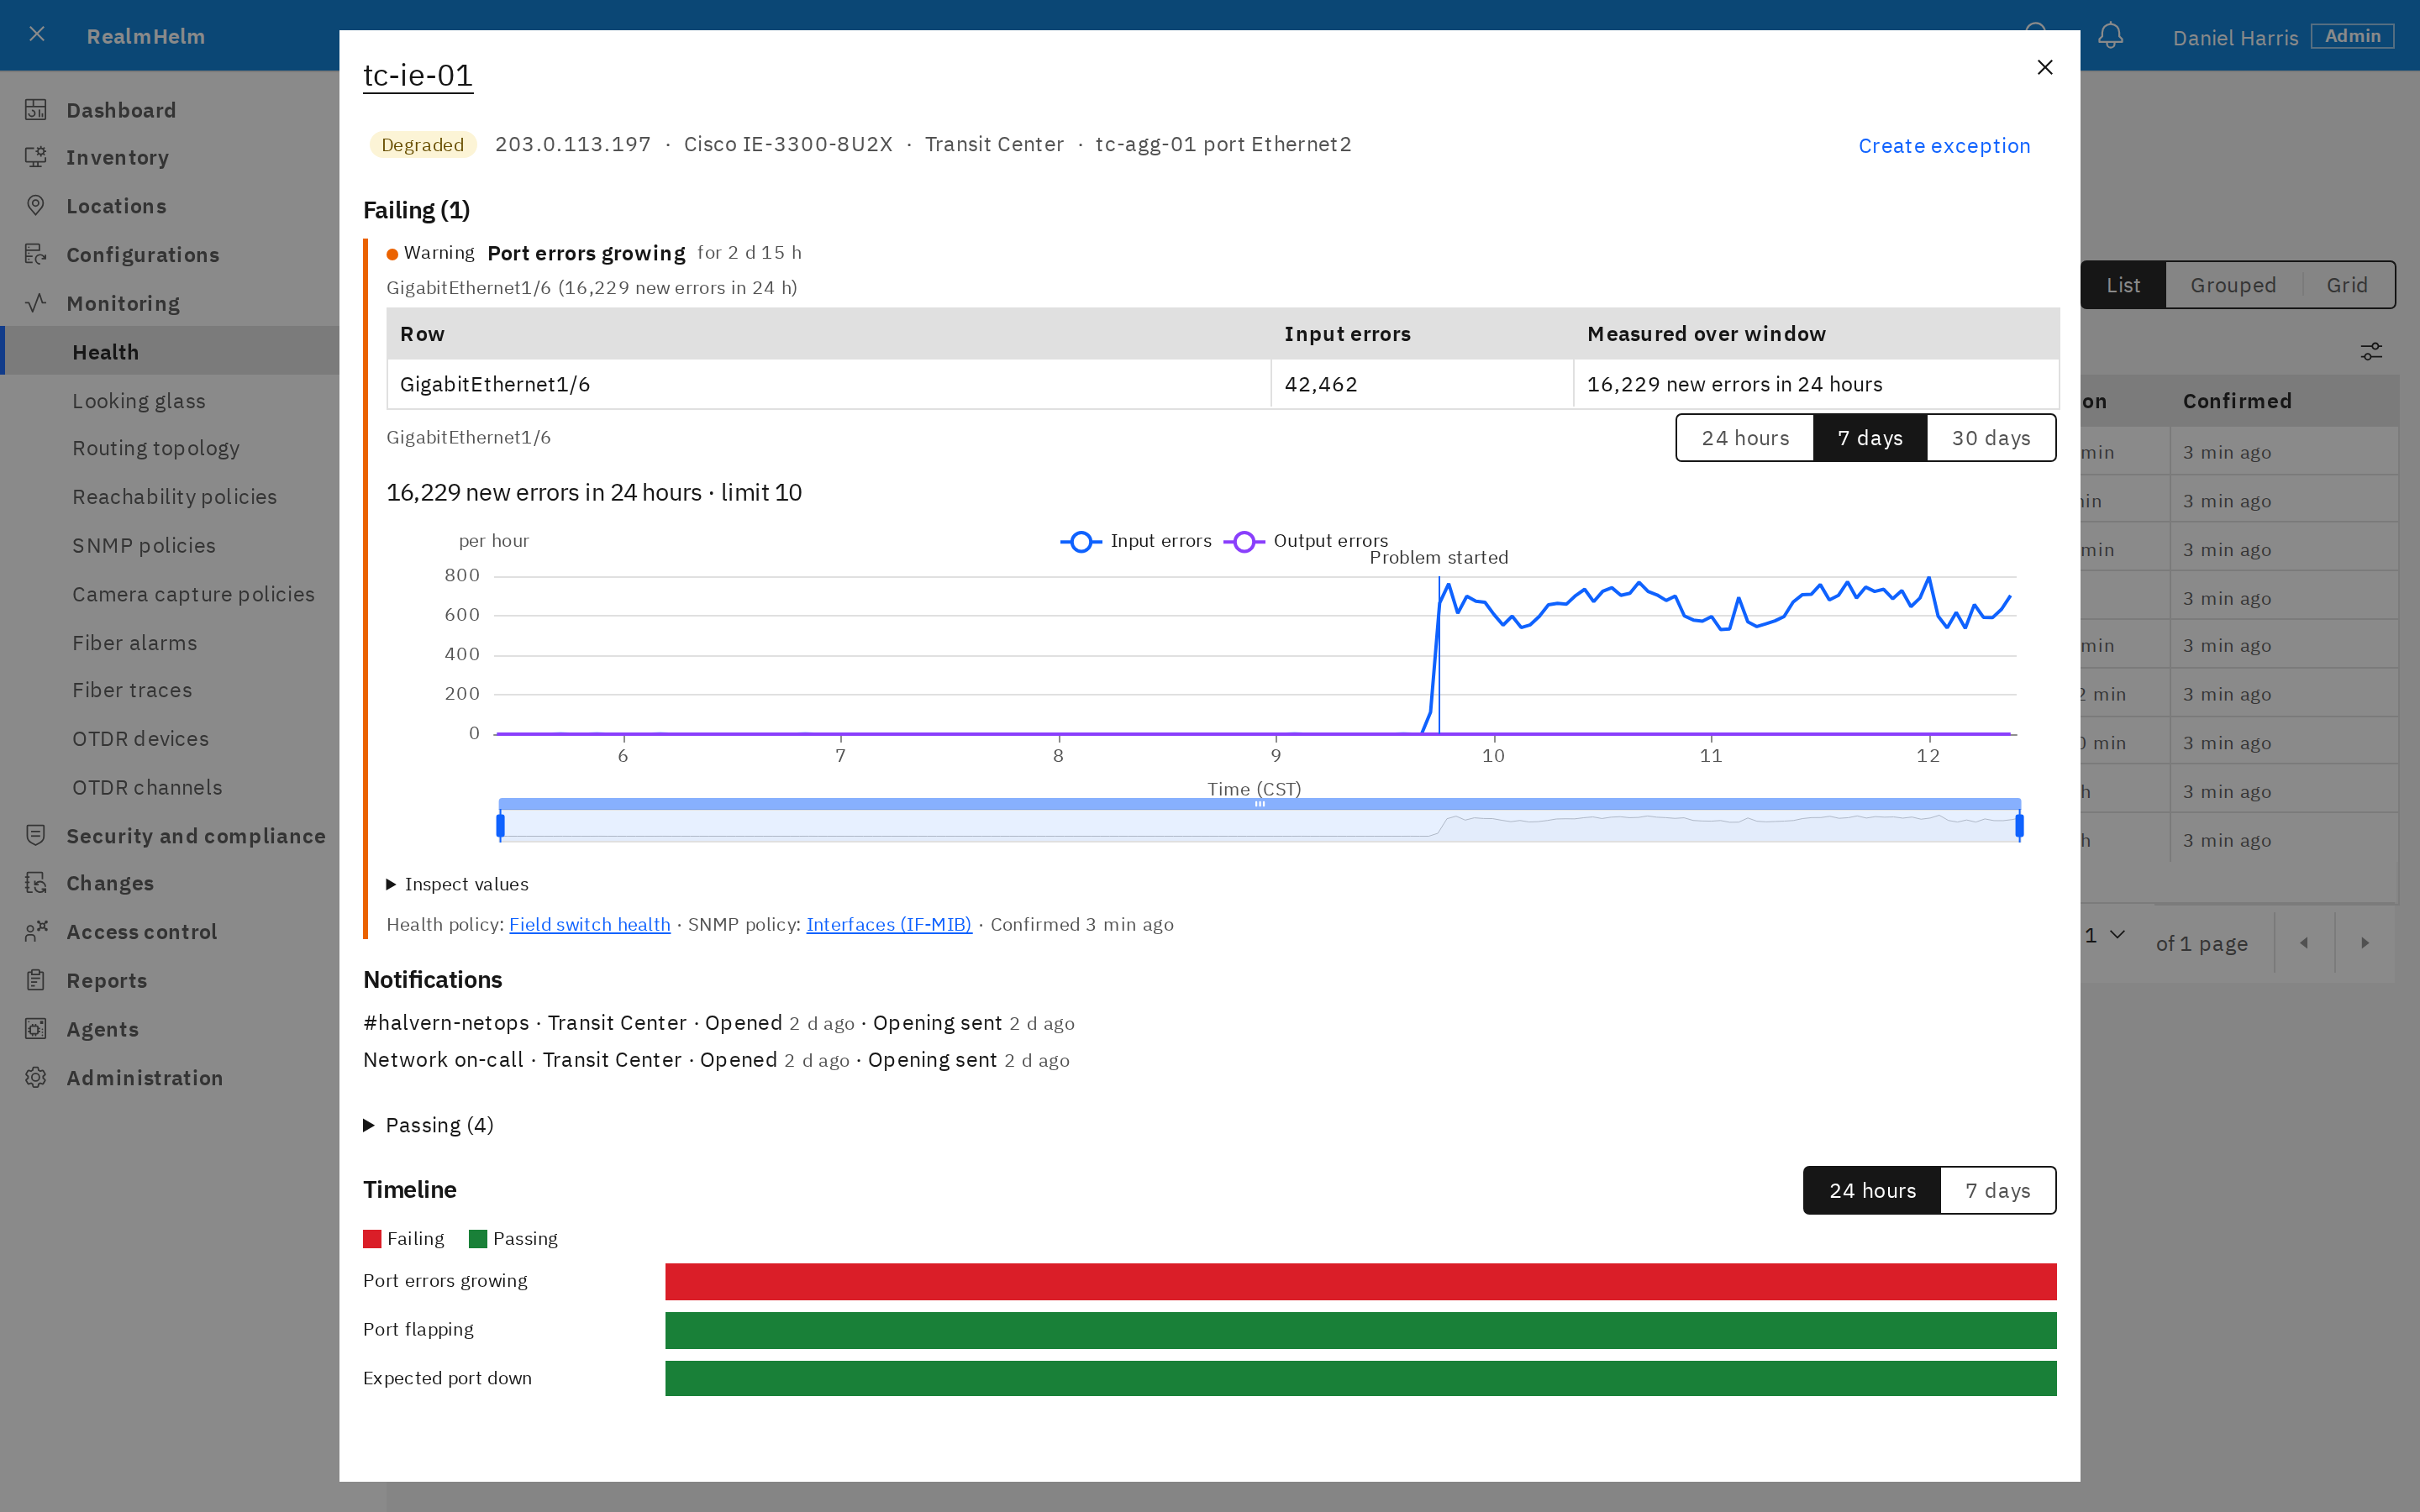
See the reading behind an issue
Monitor ICMP, TCP and HTTP availability, SNMP interfaces, sensors, power systems and supported radio links. Import alerts from Nutanix Prism.
Open an issue to inspect its measured values, history and rule threshold.
- Monitoring policies
- Use built-in rules or upload vendor MIBs and define your own fields and thresholds. Preview rule impact against recorded data.
- Collection coverage
- Find devices with missing, failed or stale data, grouped by cause.
- Notifications
- Send location-based alerts to email, Slack, Microsoft Teams workflow webhooks or HTTPS webhooks. Send a clearing message when an issue resolves.
Time-limited exceptions can suppress selected health checks.
Optional Cameras module
Camera image health
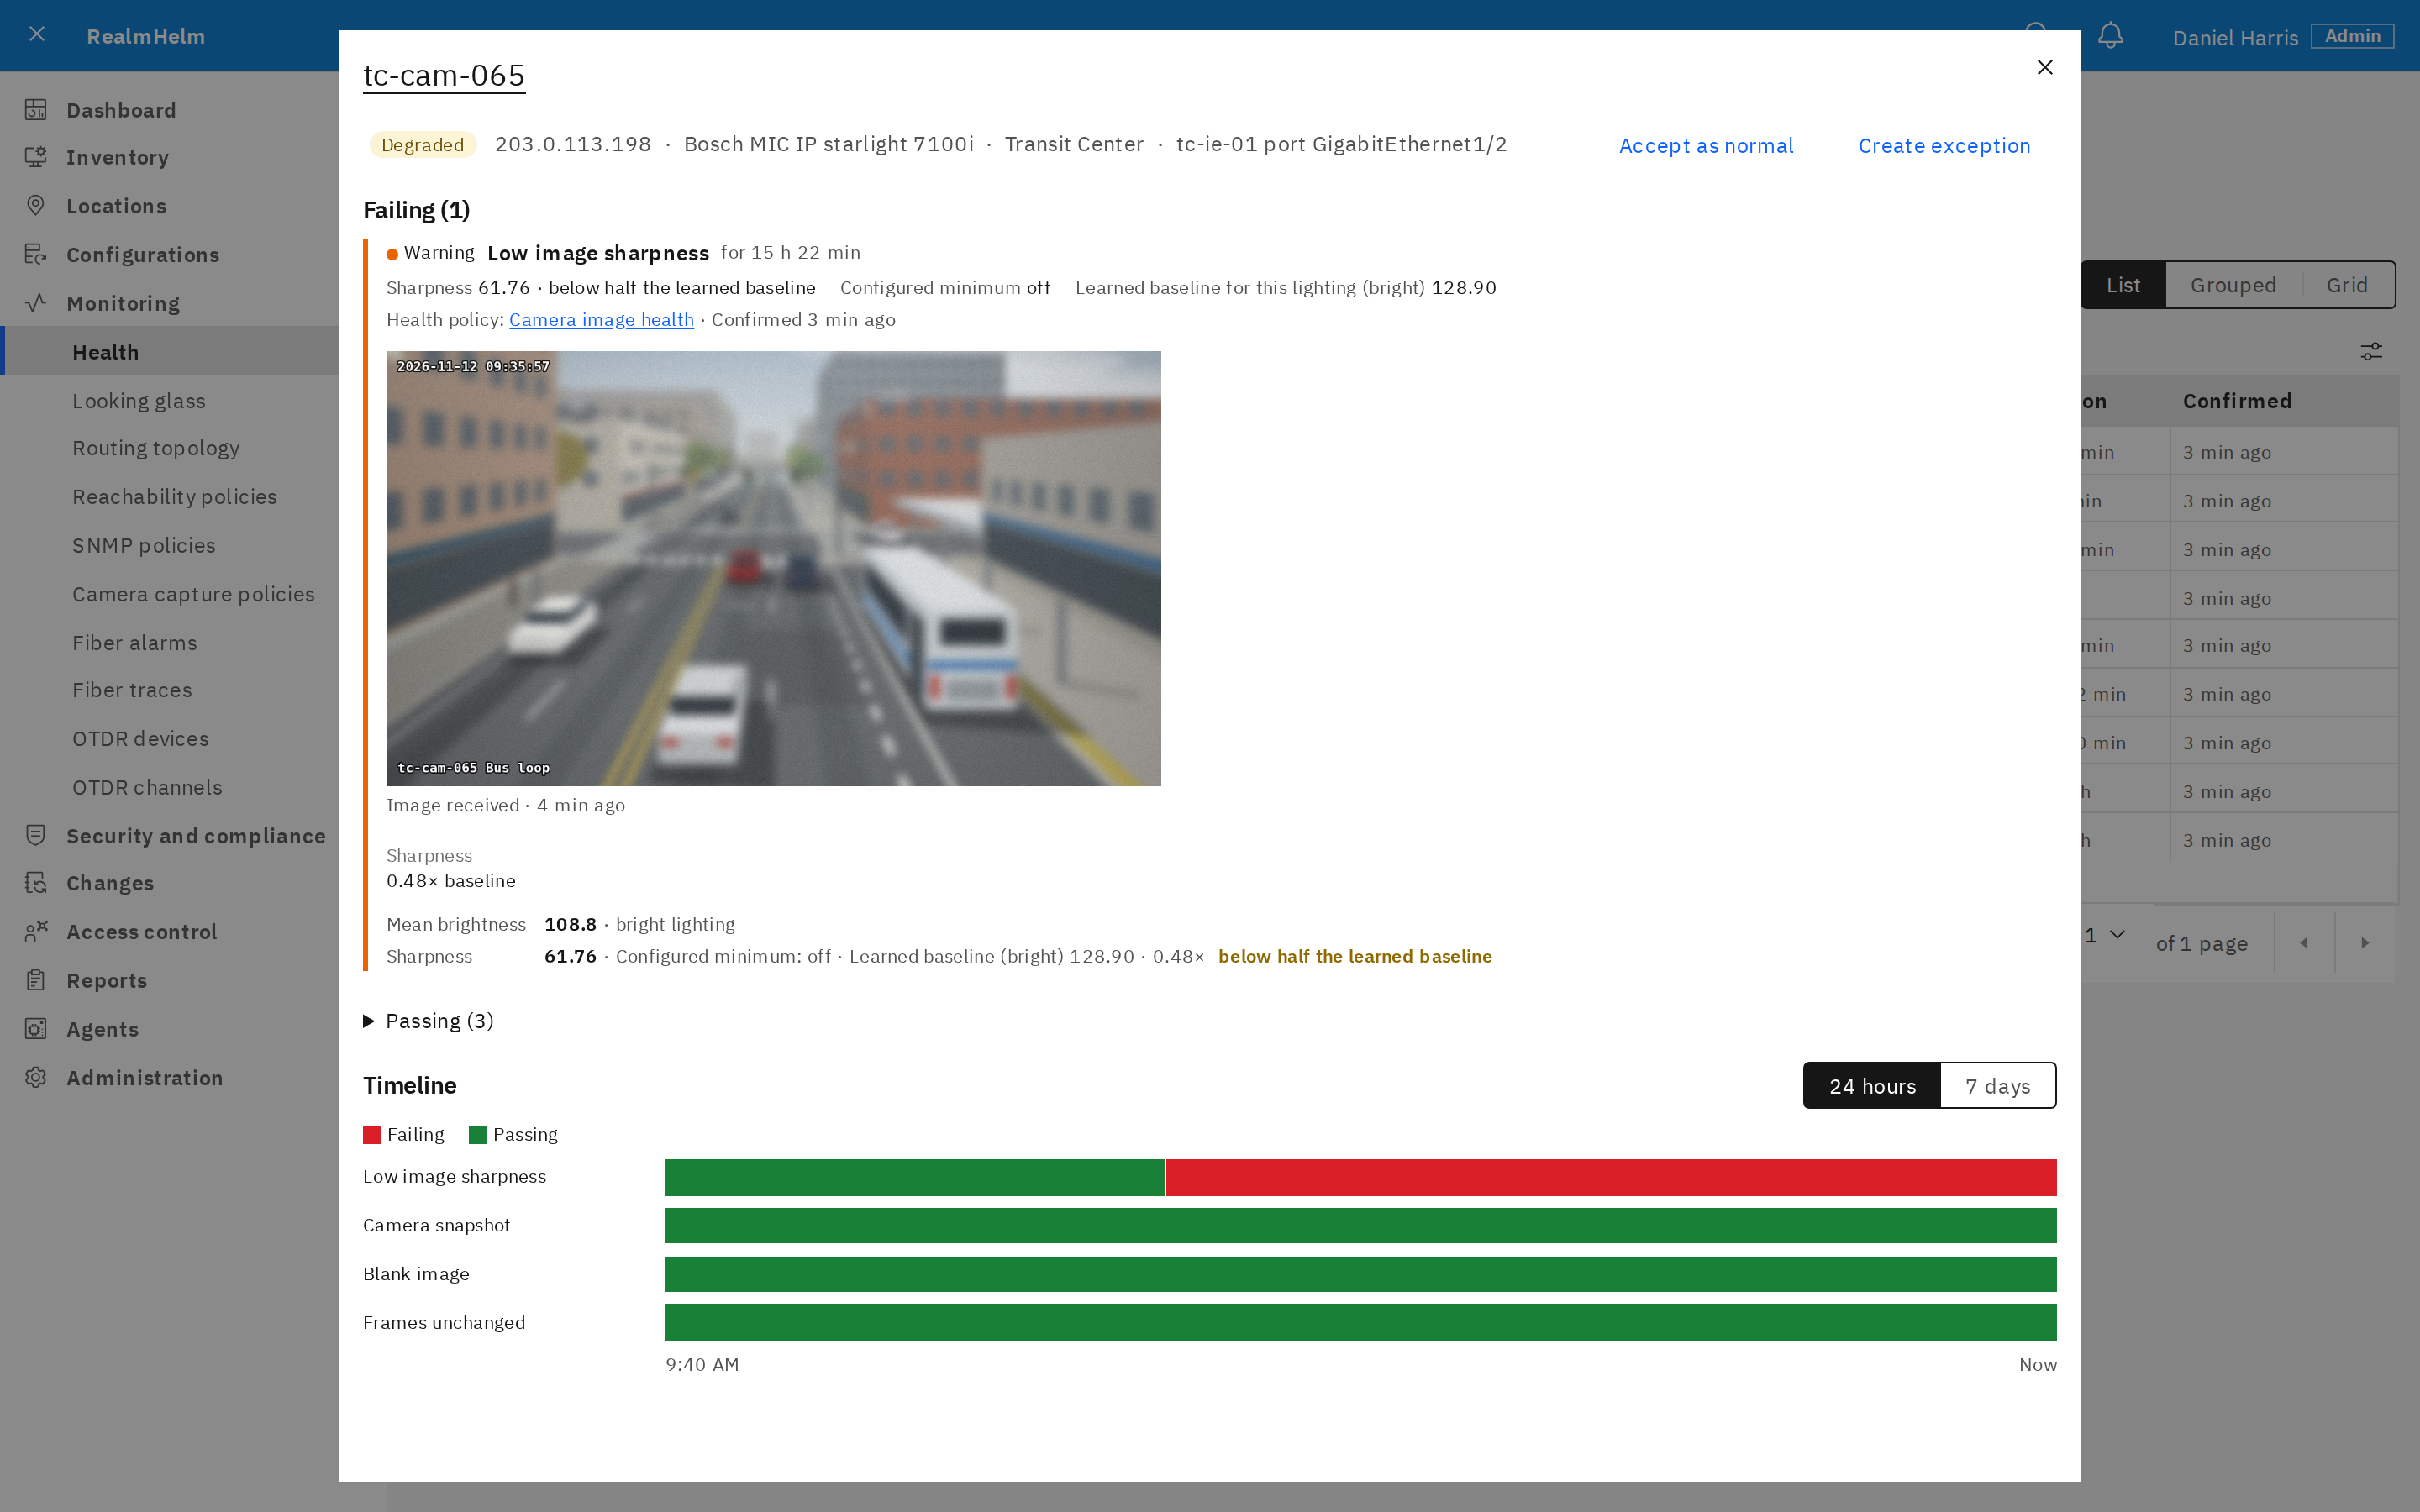
Sync cameras and their locations from Milestone XProtect, and check each camera's latest frame for blur, exposure, blank images and frozen feeds.
Cameras join inventory automatically and are linked to the network devices they connect to. The latest frame shows on the camera's location page and on the map.
Compare measurements with fixed thresholds or each camera's learned baseline for its lighting conditions. A frozen feed is checked again before it is flagged. Review frames and findings in the Health Grid, then reset or accept a baseline as needed.
Requires Milestone XProtect, recording server access and a site agent.
Optional Fiber module
Dark fiber monitoring
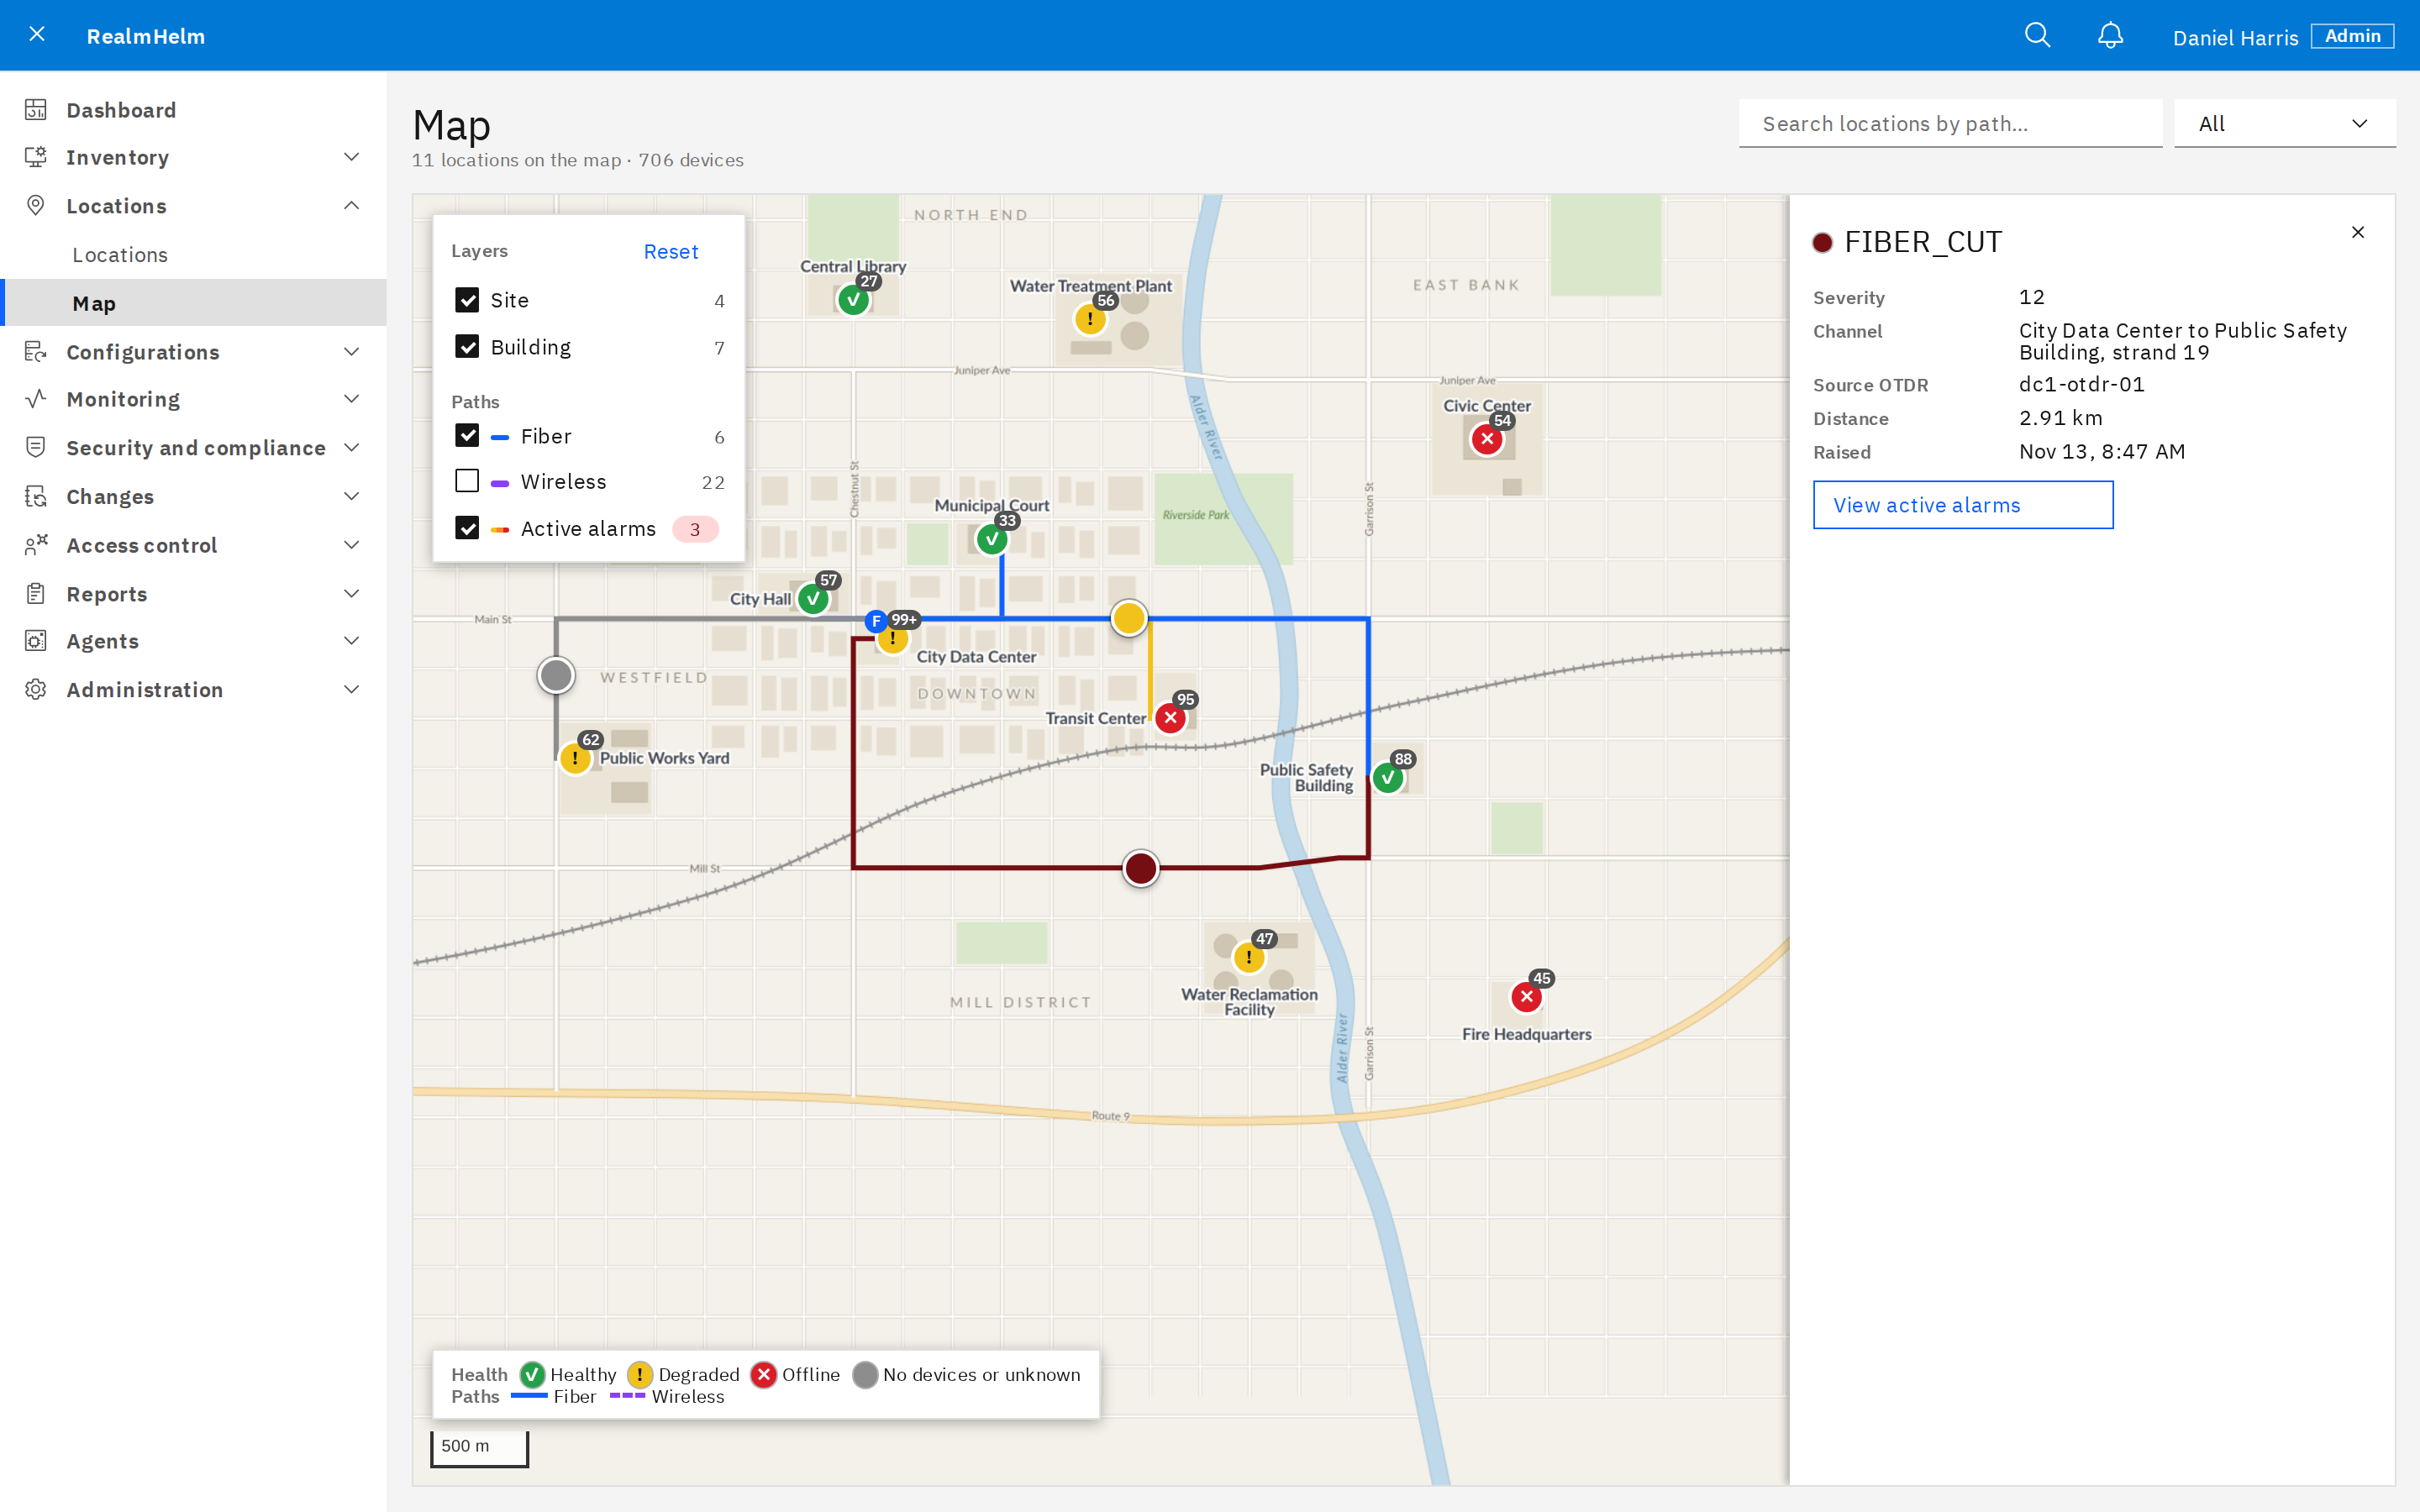
Collect alarms and channel information from compatible OTDR units.
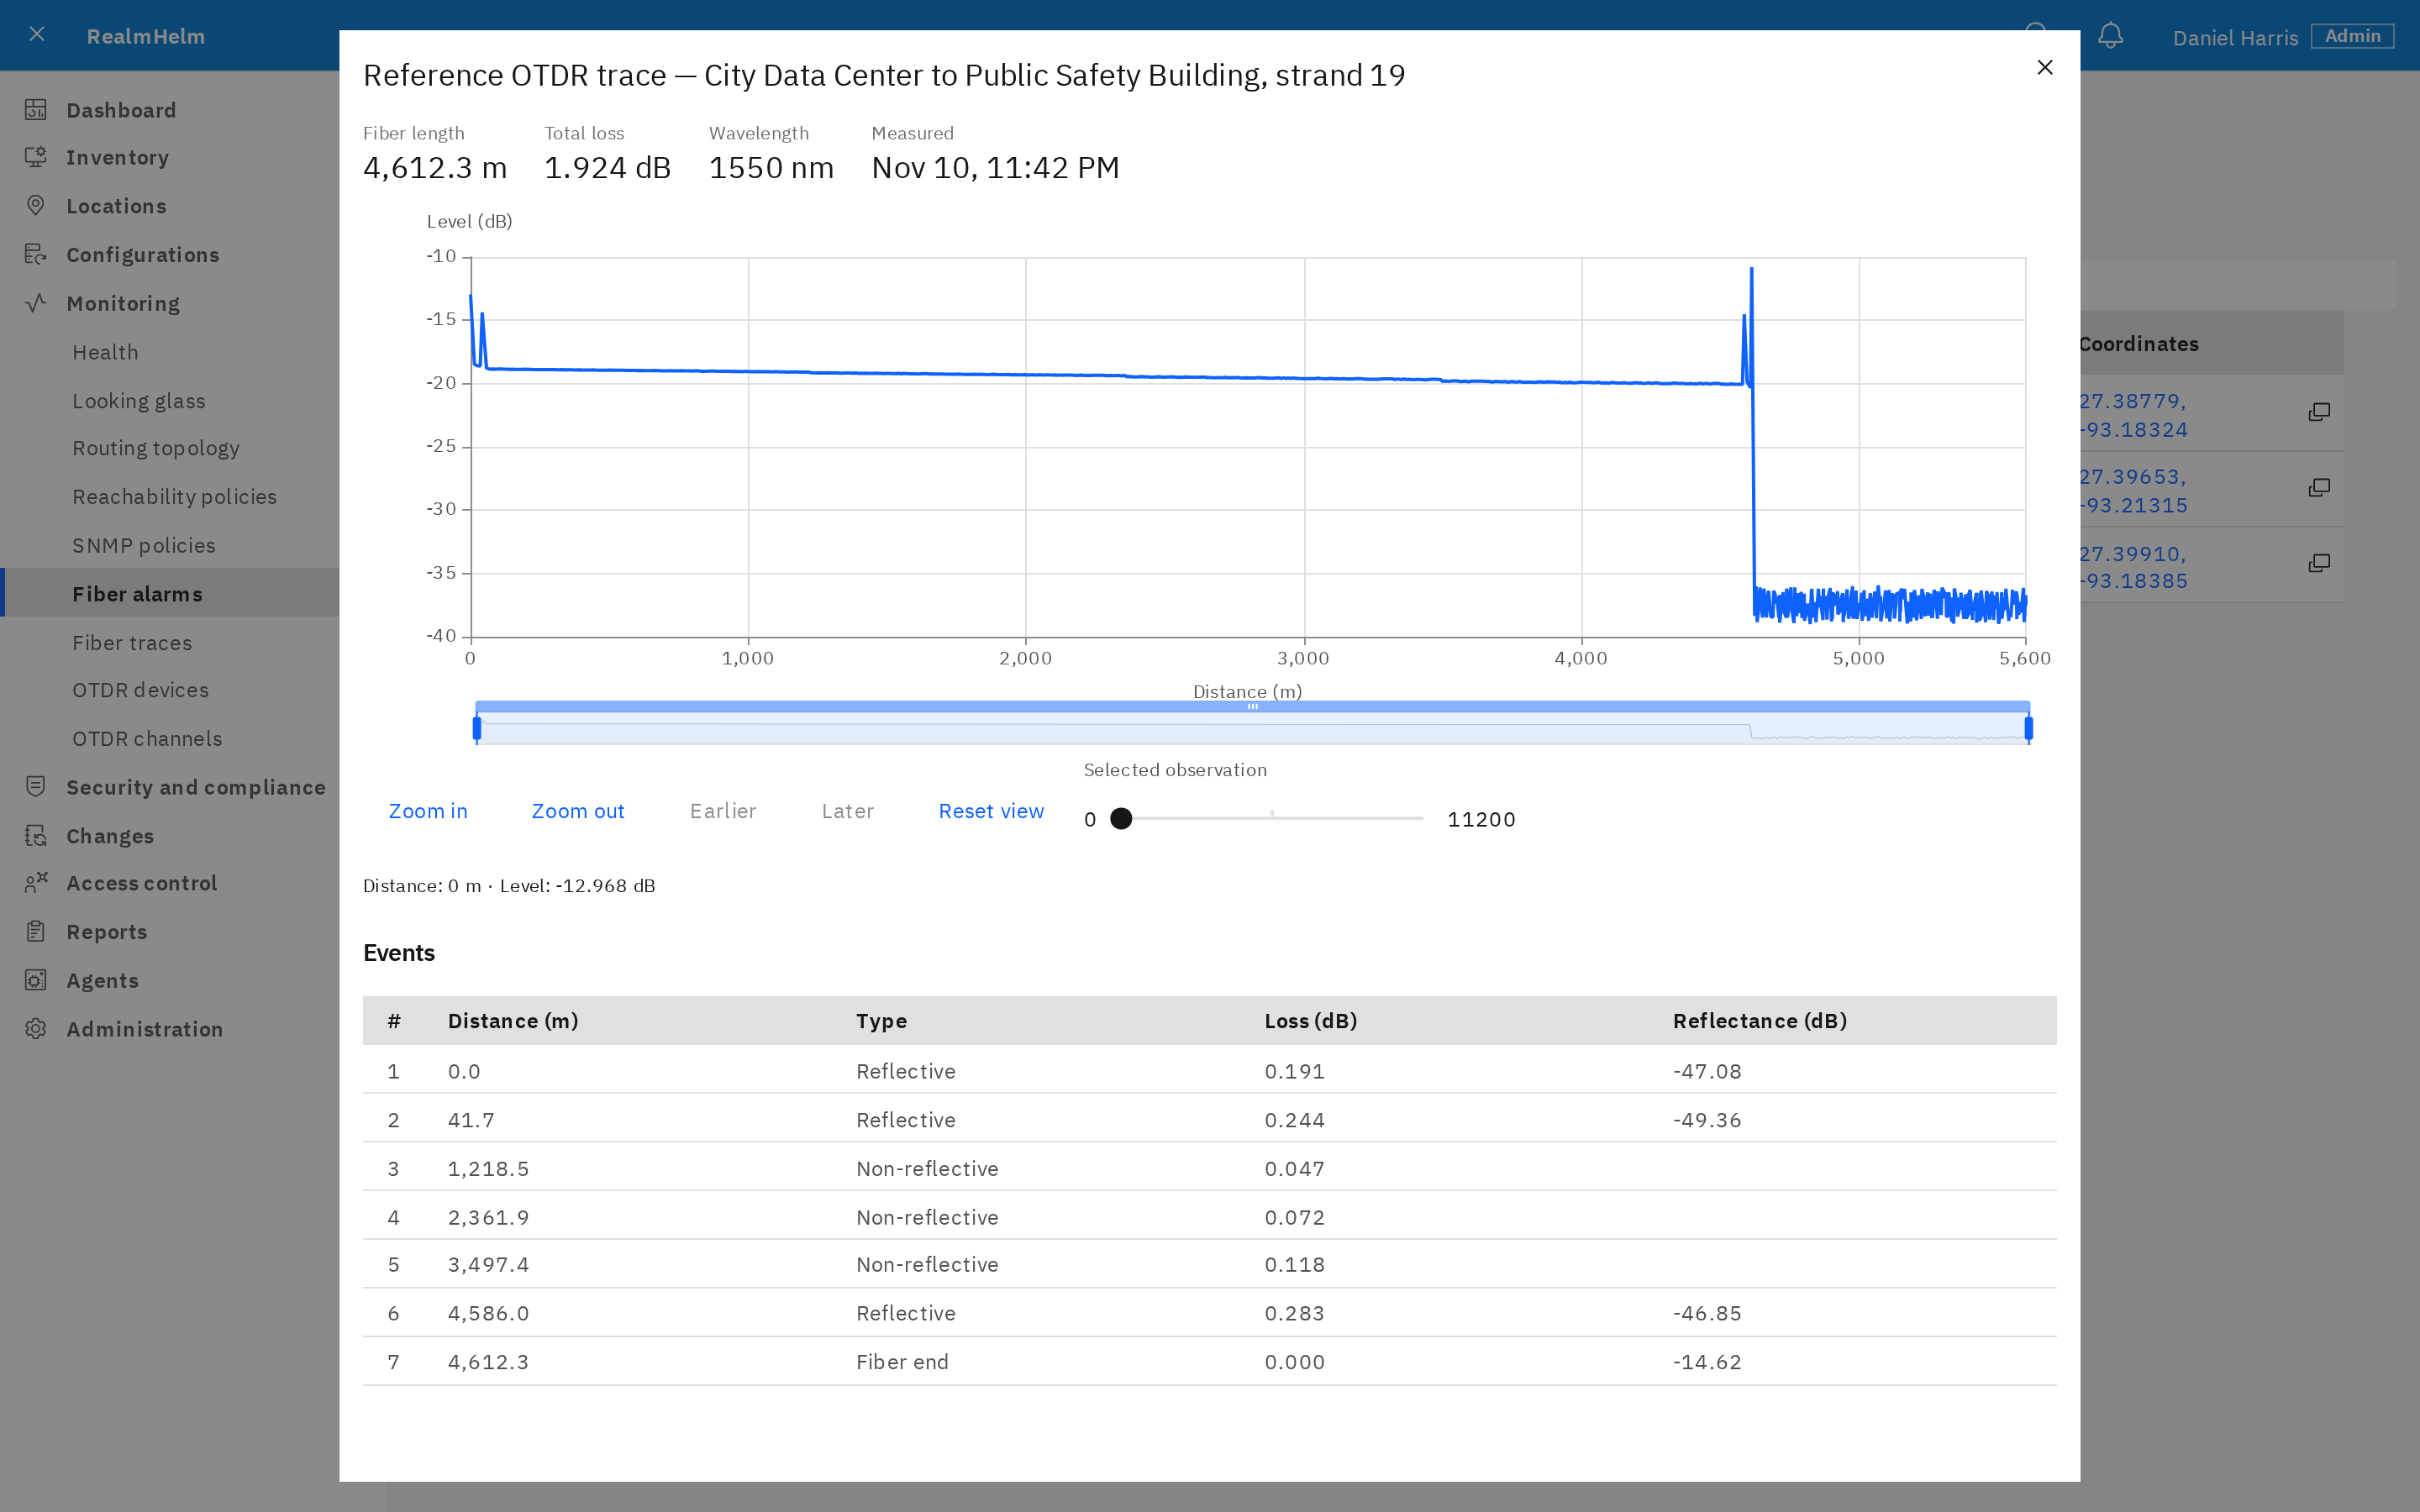
Review the fault distance and loss reported by the OTDR, receive Fiber alerts and view a channel's stored reference trace in the browser.
Requires compatible OTDR equipment and its HTTP API. Fault detection comes from the OTDR. Confirm equipment compatibility with us before deployment.
Route Collector role
Routing investigation
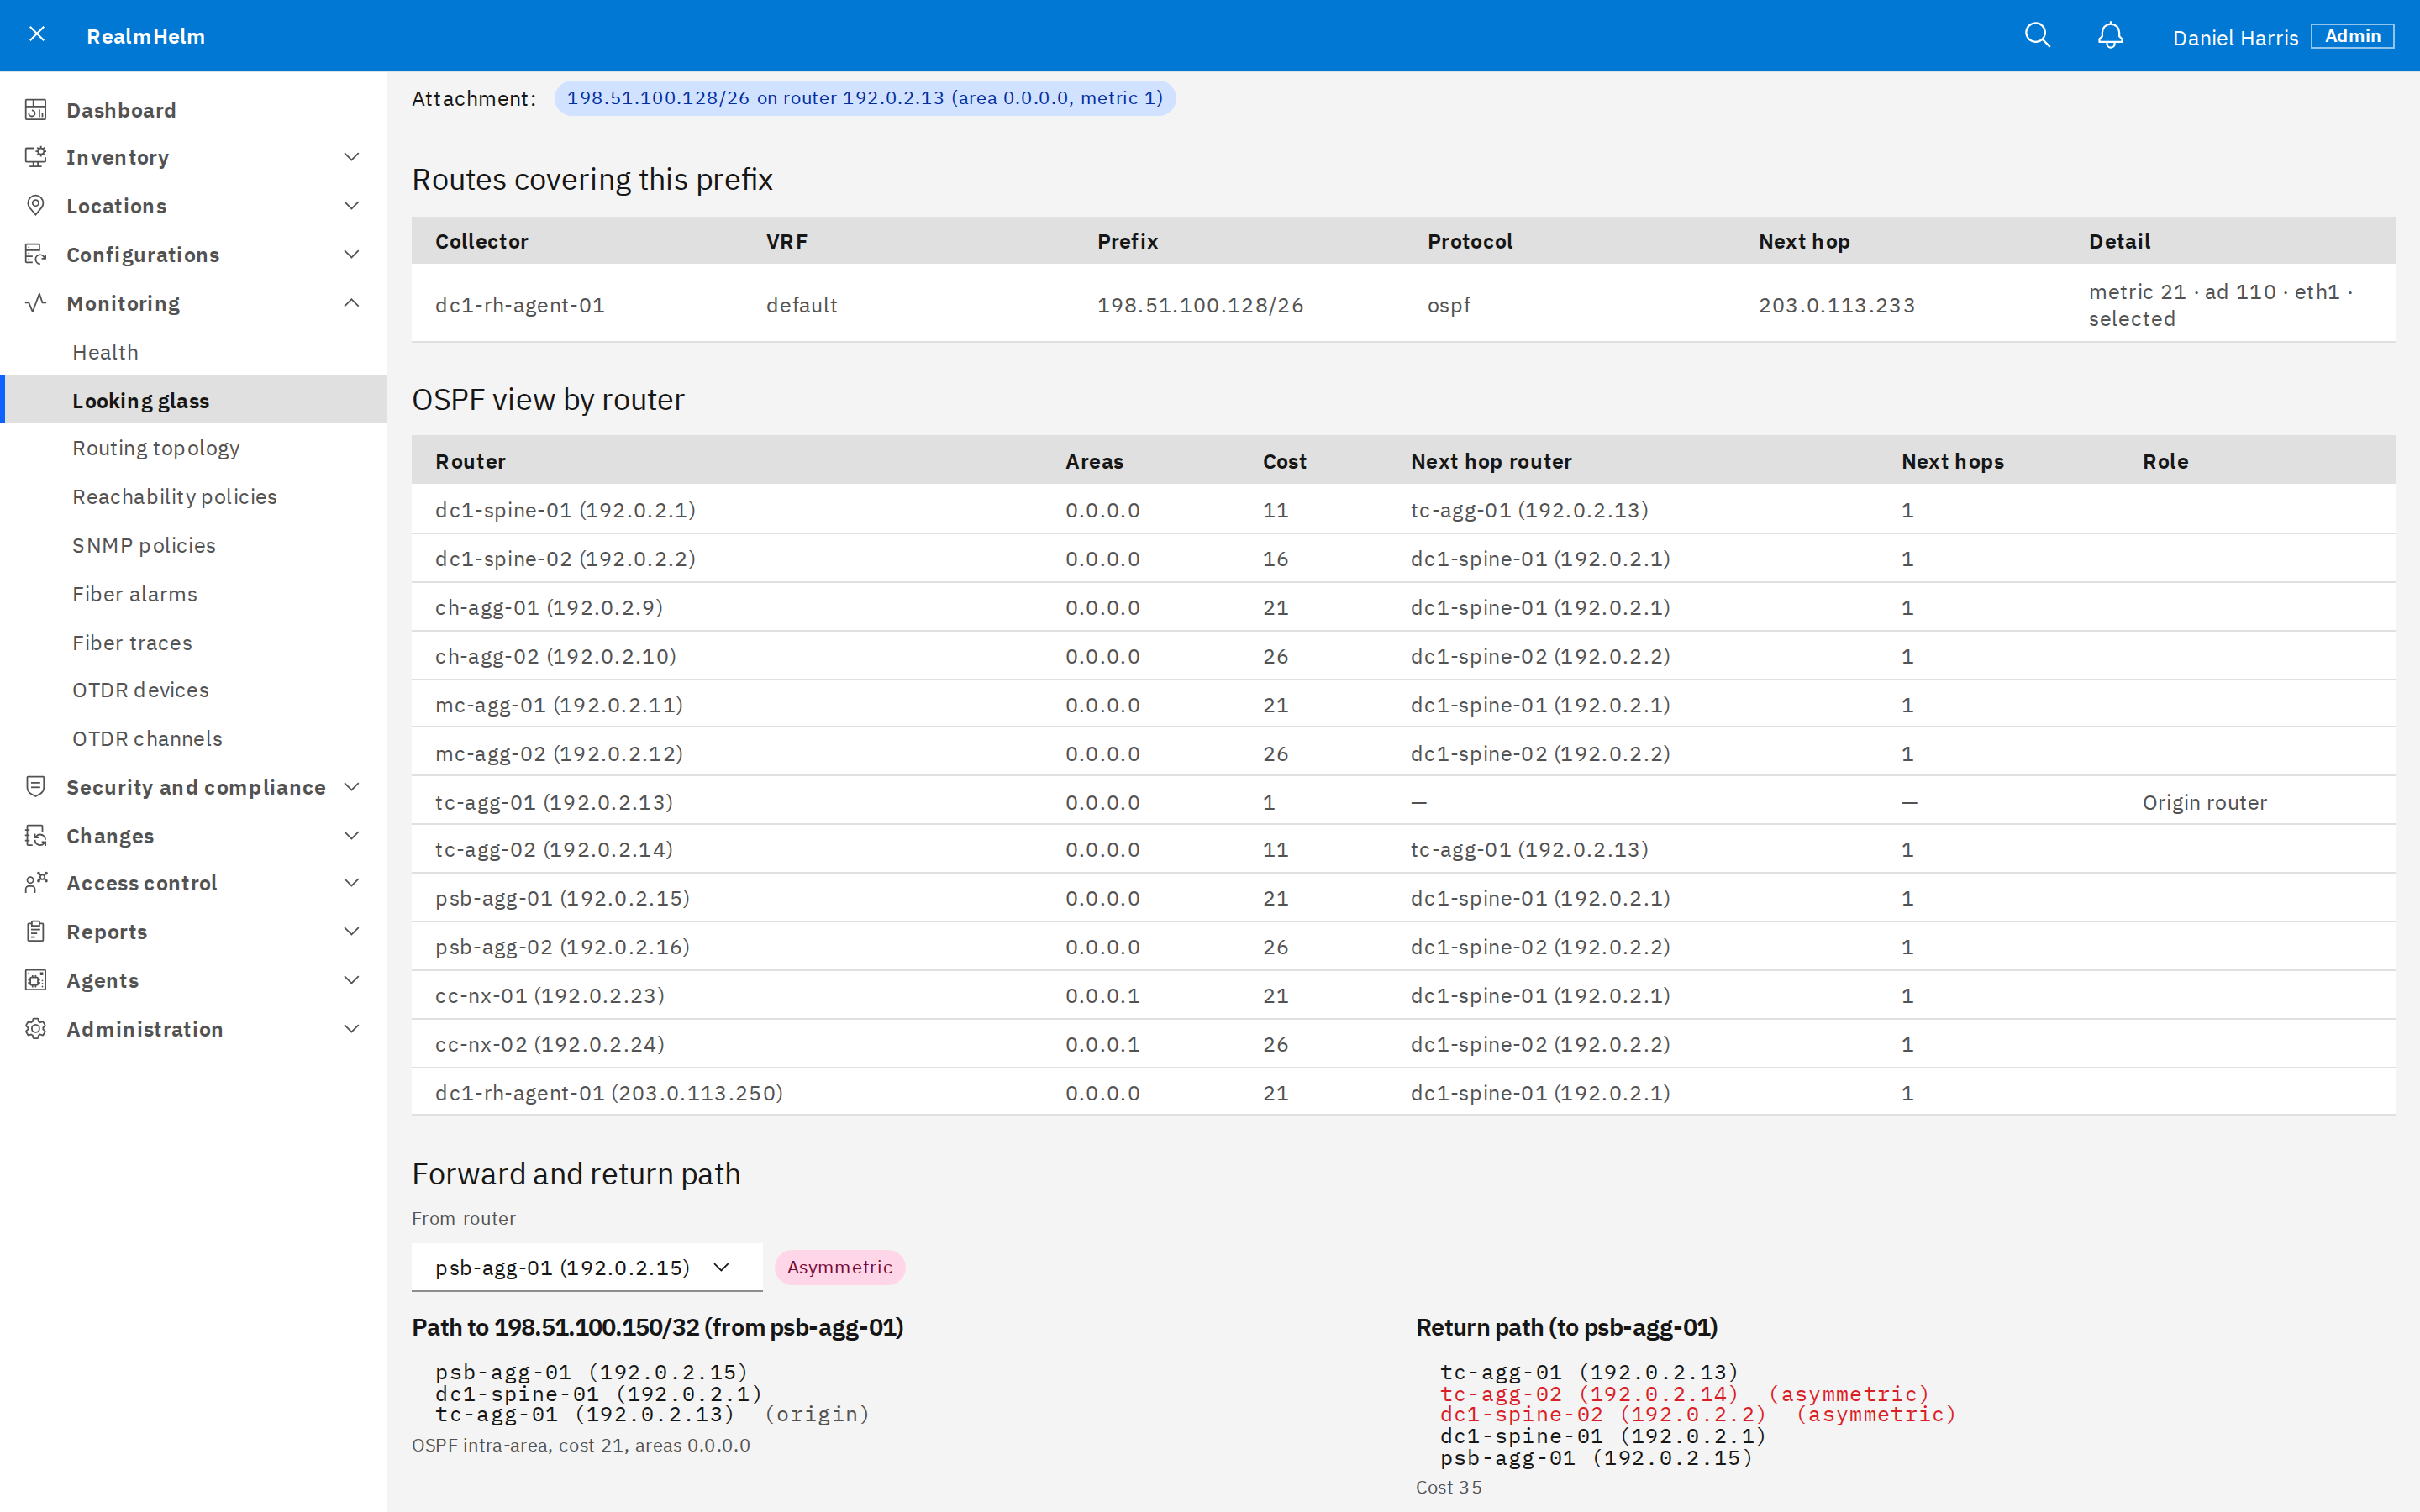
Find the router that advertises an address or prefix and see how every router reaches it.
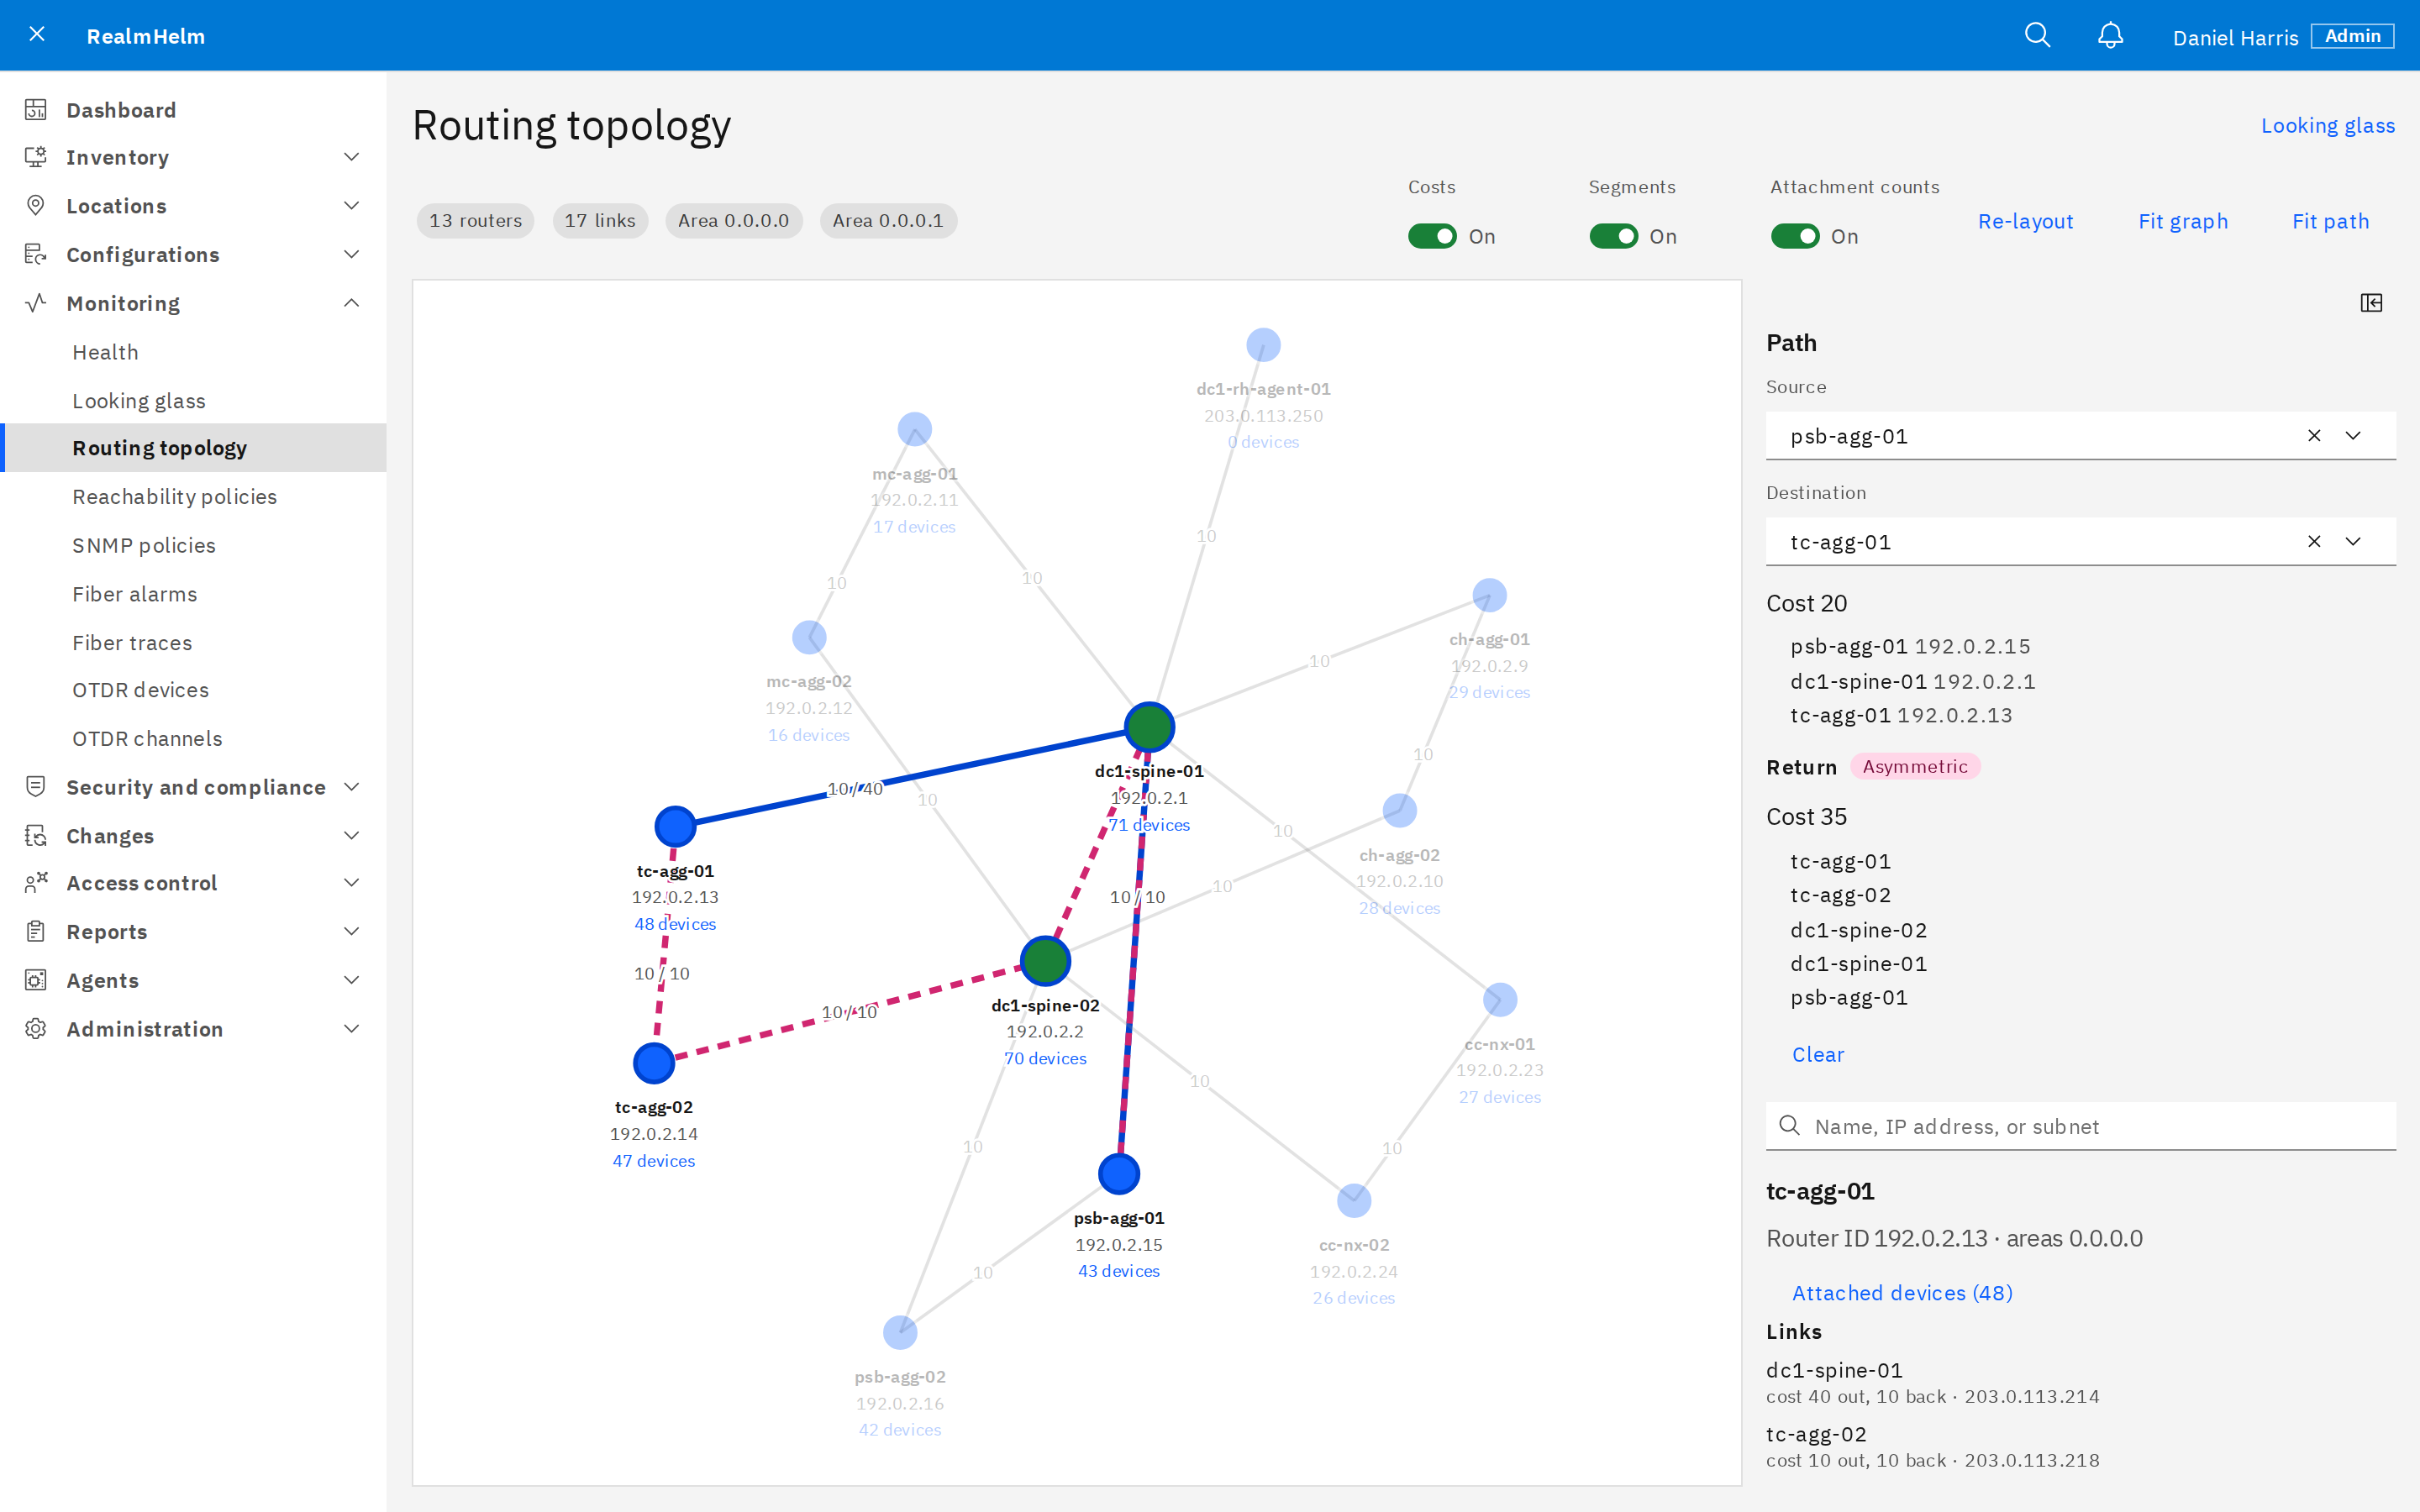
View the routing topology with link costs and the devices attached to each router. Work out paths in both directions, including equal-cost paths, and see where the return path differs. The collector learns OSPF passively, through an adjacency or BGP-LS. AI agents can run the same lookups through rhctl.
Requires a site agent with the Route Collector role. Covers OSPF for IPv4. BGP-LS carries the OSPF topology.
See it in RealmHelm
Talk with an engineer about your equipment and the work you need to do.